Climate change studies involve investigation of daily meteorological variables, e.g., the future change of the number of frost days is assessed. The modification in the frequency of these events has more significant impact on many areas (e.g., human health, agriculture) than the monthly or seasonal mean changes. Therefore, their investigation is essential for developing targeted adaptation plans.
Quantification of these events is based on climate indices derived from daily minimum, average, maximum values or daily sums of meteorological variables (mainly temperature and precipitation). Climate indices often describe extreme events that are associated with statistically rare values at the lower or upper tails of the distribution functions (e.g., extremely hot days occur only a few times in a year in Hungary). However, some indices characterize frequent events, e.g., frost days happen through one-quarter of the year in Hungary.
The most commonly used indices inform us about the frequency of a variable crossing or its duration of being over/under a given threshold., e.g., on extremely hot day daily maximum temperature is at least 35 °C; dry periods are defined as consecutive days when daily precipitation is below 1 mm. Thanks to the fixed thresholds, these indices are easily quantifiable and also interpretable. However, it is not straightforward to use these indices for comparing areas with different climate because the frequency of a variable crossing a given threshold can vastly differ by regions. In order to partially resolve this problem, percentile-based indices were introduced. In this case fix percentage values (usually the lower or upper deciles) of the distribution function are defined on a reference period to specify the thresholds, then the frequency of crossing this threshold is quantified for the future.
Some climate indices along with their definitions and units (including the ones we use most commonly) are summarized in Table 1. More indices with their definitions can be found at the WCRP and ECA&D websites.
| Index | Name | Definition | Unit |
| Crossing fix threshold | |||
| Temperature | |||
| FD | Frost days | Tmin < 0 °C | days |
| TN-10LT | Extremely cold days | Tmin < -10 °C | days |
| TX0LT | Winter days | Tmax < 0 °C | days |
| TN20GT | Tropical nights | Tmin > 20 °C | days |
| SU | Summer days | Tmax > 25 °C | days |
| TX30GE | Hot days | Tmax ≥ 30 °C | days |
| TX35GE | Extremely hot days | Tmax ≥ 35 °C | days |
| DTR | Diurnal temperature range | Tmax–Tmin | °C |
| Precipitation | |||
| RR0.1 | Days with precipitation above 0.1 mm | Rday ≥ 0.1 mm | days |
| RR1 | Rainy days | Rday ≥ 1 mm | days |
| RR5 | Days with precipitation above 5 mm | Rday ≥ 5 mm | days |
| RR10 | Heavy precipitation days | Rday ≥ 10 mm | days |
| RR20 | Extremely heavy precipitation days | Rday ≥ 20 mm | days |
| RX1 | Maximum 1-day precipitation | Max (Rday) | mm |
| RX5 | Maximum precipitation amount in 5 consecutive days | Max (Rday i, i+1, i+2, i+3, i+4) | mm |
| SDII | Precipitation intensity | Precipitation/number of rainy days | mm/day |
| Duration based | |||
| Temperature | |||
| CFD | Maximum number of consecutive frost days | Longest period, when Tmin < 0 °C | days |
| HEAT | First-degree heat wave Second-degree heat wave Third-degree heat wave |
Tave ≥ 25 °C for 1 day Tave ≥ 25 °C for 3 days or ≥ 27 °C for 1 day Tave ≥ 27 °C for 3 days |
days |
| GSL | Growing season length | Begins if Tave> 5 °C, ends if Tave < 5 °C (after July) for 6 consecutive days | days |
| LFD | Length of frost-free period | Begins with the last day in spring when Tmin < 0 °C and ends with the first day in autumn when Tmin < 0 °C | days |
| Precipitation | |||
| CDD | Maximum number of consecutive dry days | Longest period, when Rday < 1 mm | days |
| CWD | Maximum number of consecutive wet days | Longest period, when Rday ≥ 1 mm | days |
| Percentile based | |||
| Temperature | |||
| TX10p | Ratio of cold daytimes | Tmax < lower decile of Tmax (reference) | % |
| TN90p | Ratio of warm nighttimes | Tmin > upper decile of Tmin (reference) | % |
| TG10p | Ratio of cold days | Tave< lower decile of Tave (reference) | % |
| TG90p | Ratio of warm days | Tave > upper decile of Tave (reference) | % |
| WSDI | Number/length of warm periods | Tmax > upper decile of Tmax (reference) for at least 6 consecutive days | no, days |
| CSDI | Number/length of cold periods | Tmin < lower decile of Tmin (reference) for at least 6 consecutive days | no, days |
| Others | |||
| SPI | Standardized precipitation index | (R-Ravg)/standard deviation on an annual/seasonal basis | - |
| CEI | Climate extremes index | It examines the area affected by extremes, based on Tmin, Tmax, upper and lower deciles of R and Standardized Precipitation Index | % |
In the following, some examples for the changes of climate indices are shown for Hungary. Figure 1 depicts the annual changes of hot days, while Figure 2 shows the autumn precipitation intensity change - both based on the results of regional climate models applied at OMSZ. According to the investigated three simulations, hot days will remarkably increase by the end of the 21st century, by at least 20, in some areas by up to 50 days with respect to the reference period. Model results also indicate the increase of autumn precipitation intensity over Hungary.
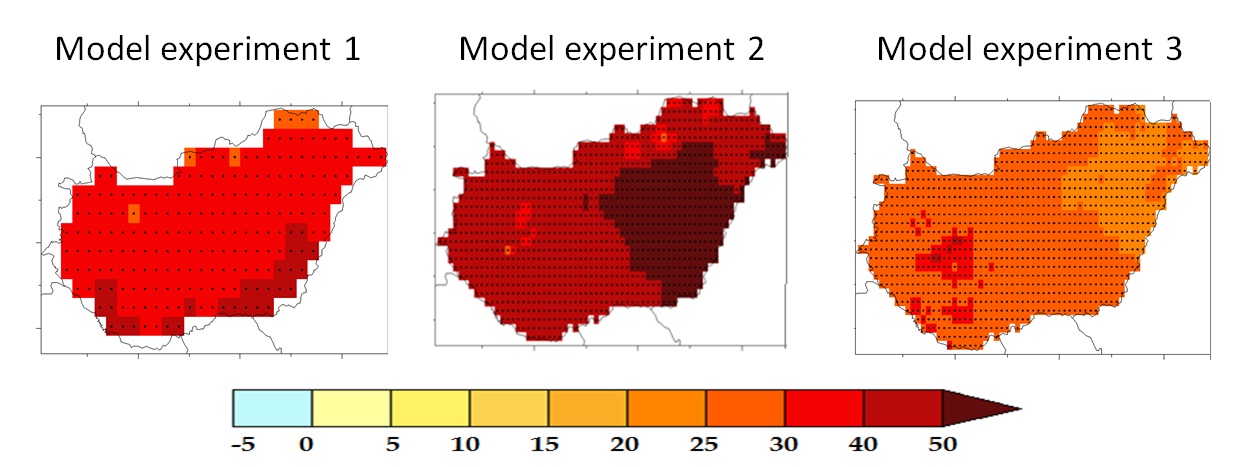
Figure 1
Changes (in days) in the annual number of hot days by 2071–2100 compared to 1971–2000 based on the
results of three model simulations of OMSZ; significant changes are marked with dots
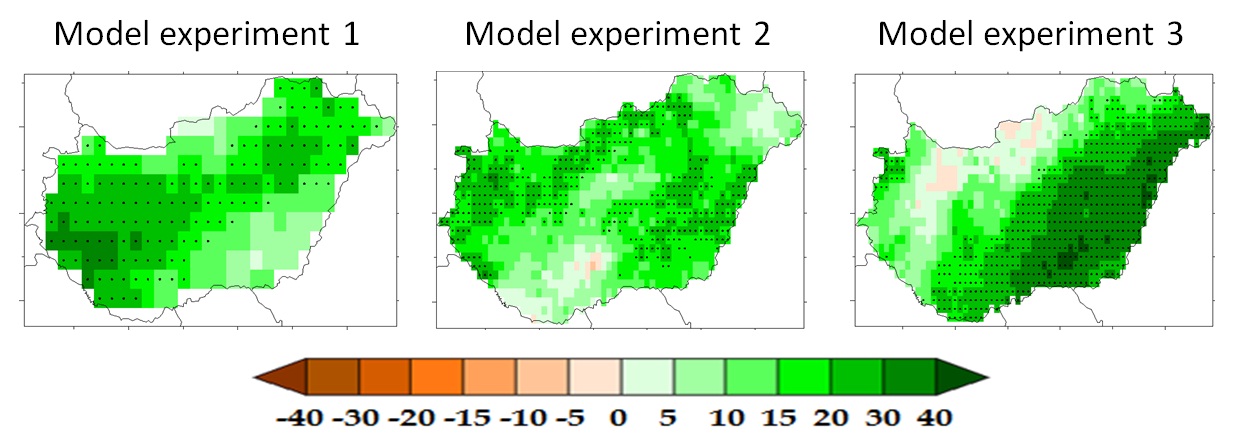
Figure 2
Changes (in %) in the autumn precipitation intensity by 2071–2100 compared to 1971–2000 based on the
results of three model simulations of OMSZ; significant changes are marked with dots